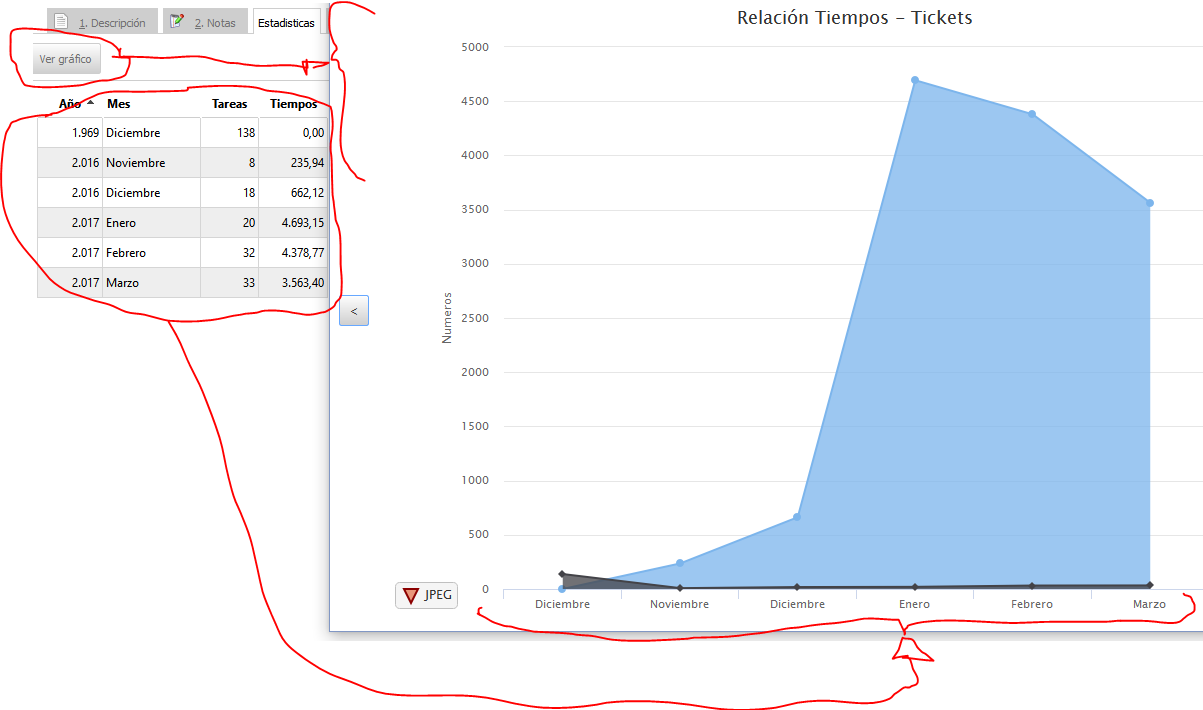
La verdad no entendi a lo que haces referencia, comparto el codigo HTML de la segunda grafica que es la que no realiza la funcion:
“<html>
<head>
<title>
Chart
</title>
<meta http-equiv=‘Content-Type’ content=‘text/html; charset=utf-8’>
<link rel=‘stylesheet’ href=‘https://maxcdn.bootstrapcdn.com/bootstrap/3.3.7/css/bootstrap.min.css’>
<script src='file:///”+sysCacheClientPath+"/canvg.js’></script>
<script src=‘file:///"+sysCacheClientPath+"/rgbcolor.js’></script>
<script src=‘file:///"+sysCacheClientPath+"/jquery.min.js’></script>
<script src=‘file:///"+sysCacheClientPath+"/bootstrap.min.js’></script>
<script src=‘file:///"+sysCacheClientPath+"/jquery-1.9.1.js’ type=‘text/javascript’></script>
<script src=‘file:///"+sysCacheClientPath+"/highcharts.js’ type=‘text/javascript’></script>
<script src=‘http://code.highcharts.com/modules/exporting.js’></script>
<script type=‘text/javascript’>
$(function () {
Highcharts.setOptions({
// Opciones del gráfico para la exportación
// Se tienen en cuenta en la función getSVGForExport
lang: {
contextButtonTitle: ‘Exportar gráfico a Velneo’
},
chart: {
// Espacio para que quepa el botón de exportar
spacing: [10, 10, 10, 60],
borderWidth: 0
},
exporting: {
chartOptions: {
// chart: {backgroundColor: ‘transparent’},
chart: {
backgroundColor: ‘white’,
spacing: [10, 10, 15, 10],
borderWidth: 0,
width: 600,
height: 400
},
plotOptions: {
series: {
dataLabels: {
enabled: false
}
}
}
},
// Hacemos que el Botón contextual ejecute directamente la Exportación
buttons: {
contextButton: {
menuItems: null,
onclick: function () {
exportar();
},
text: ‘JPEG’,
verticalAlign: ‘bottom’,
align: ‘left’,
height: 20,
x: -60,
y: 0,
symbol: ‘triangle-down’,
symbolStroke: ‘DarkRed’,
symbolFill: ‘DarkSalmon’,
symbolStrokeWidth: 2,
symbolSize: 14,
symbolX: 16,
symbolY: 14,
theme: {
‘stroke-width’: 1,
stroke: ‘silver’,
fill: ‘WhiteSmoke’,
r: 4,
states: {
hover: {
fill: ‘Orange’
}
}
}
}
}
},
credits: {
enabled: false
}
});
});
$(function() {
$(’#container’).highcharts({
chart: {
type: ‘area’
},
credits: {
enabled: true
},
title: {
text: ‘Relación Tiempos - Tickets’,
x: -20 //center
},
yAxis: { title: { text: ‘Numeros’ } },
xAxis: { categories: ["+MES+"] },
tooltip: { pointFormat: ‘{series.name} producidpos <b>{point.y:,.0f}</b>’},
legend: { layout: ‘vertical’, align: ‘right’, verticalAlign: ‘middle’ },
plotOptions: {
area: {
marker: {
dataLabels: { enabled: true },
enableMouseTracking: true
}
}
},
series:
[
{
name: ‘Tiempos’,
data: ["+TIME+"]
},
{
name: ‘Tickets’,
data: ["+TIKC+"]
}
]
});
});
</script>
<script type=‘text/javascript’>
function exportar() {
var chart = $(’#container’).highcharts();
// svg = chart.getSVG()
svg = chart.getSVGForExport()
var chartWidth = chart.options.exporting.chartOptions.chart.width
var chartHeight = chart.options.exporting.chartOptions.chart.height
var nRelacion = chartHeight / chartWidth;
// Creamos un elemento Canvas o usamos uno ya existente
// var canvas = document.getElementById(‘canvas’)
// canvas.style.display=‘none’;
var canvas = document.createElement(‘canvas’)
canvas.width = 1200;
canvas.height = canvas.width * nRelacion;
canvg(canvas, svg, {
ignoreDimensions: true,
scaleWidth: canvas.width,
scaleHeight: canvas.height
});
var a = document.createElement(‘a’);
a.href = canvas.toDataURL(‘image/jpeg’,1);
a.click();
}
</script>
</head>
<body>
</body>
</html>"
Saludos.